

If you are an RF engineer, you might has come to a moment that you need to check the distribution of the Tracking, Routing or Location Areas. This post can help you do that in QGIS, and you will notice that is not difficult at all.
Creating areas based on points
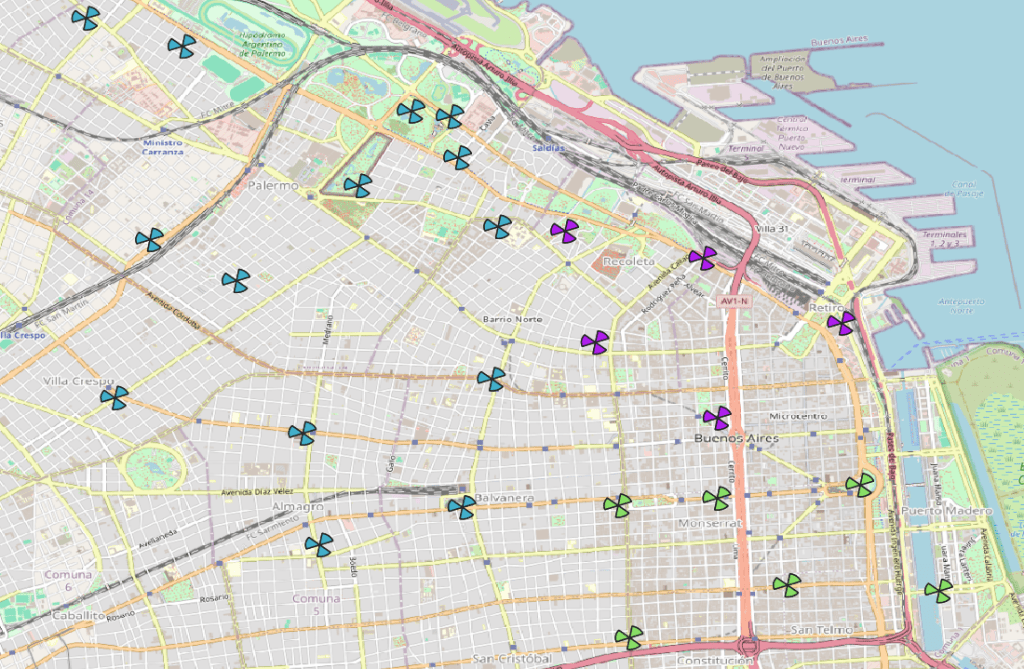
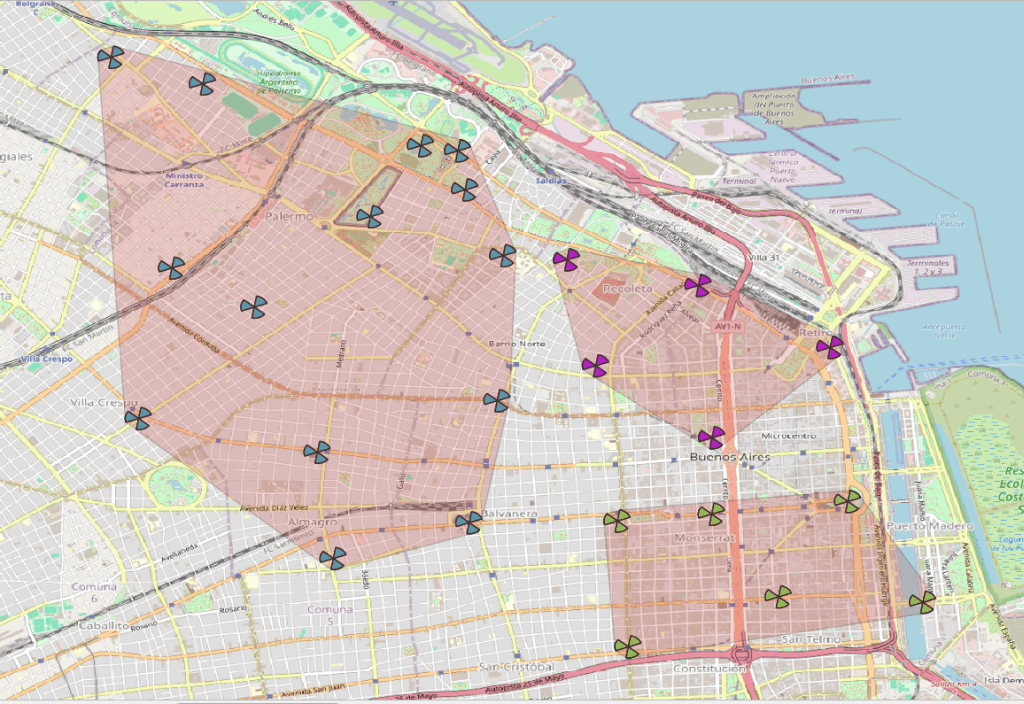
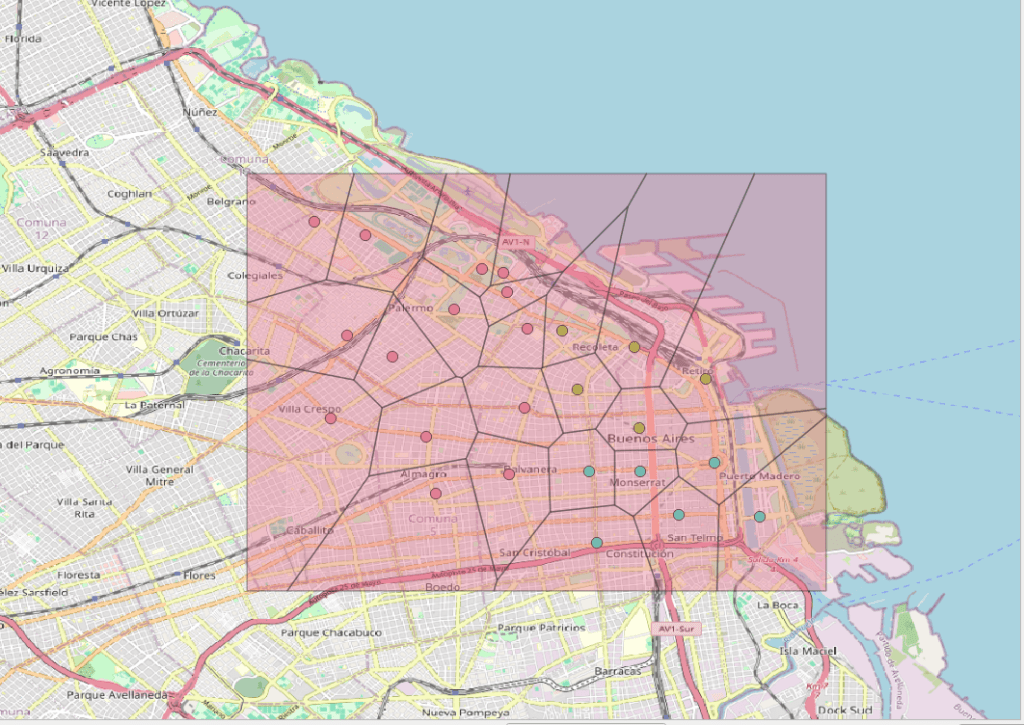
The scenario is the following: you have sites mapped as points and you need to create an area that surround those points that share a particular feature. In my case, I have a map of sites in Buenos Aires, that have a column named BA_TAC that represent a value of Tracking Area and I want to create a polygon that encapsulate the sites that belongs to each tracking area. If you want to know more how to upload a csv file to QGIS do not miss out my post Linking excel data to QGIS.
One way of doing this is by going to Layer > Create Layer > New Temporary Scratch Layer and by hand generate each polygon. That is a way of doing the job, but the idea is to get a an automatic process that draw the areas.
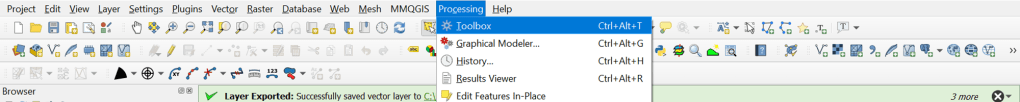
Method #1: This method is very simple, yet it might not look very fancy. First you need to go to Processing > Toolbox
On the right it will pop out a new window with a search box in the top. There you will type “bounding”:
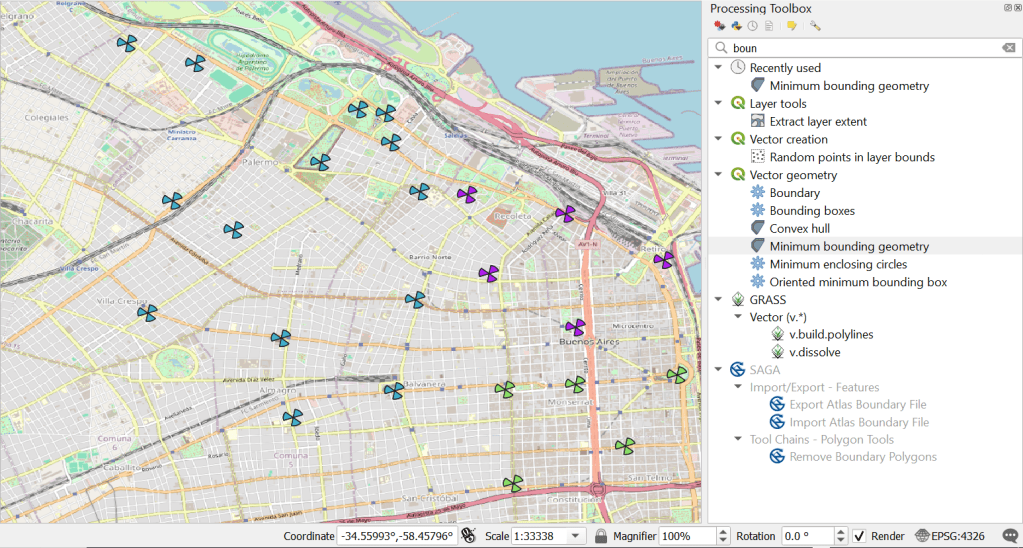
From all the options select “Minimum bounding geometry” and the following dialog box will opened:
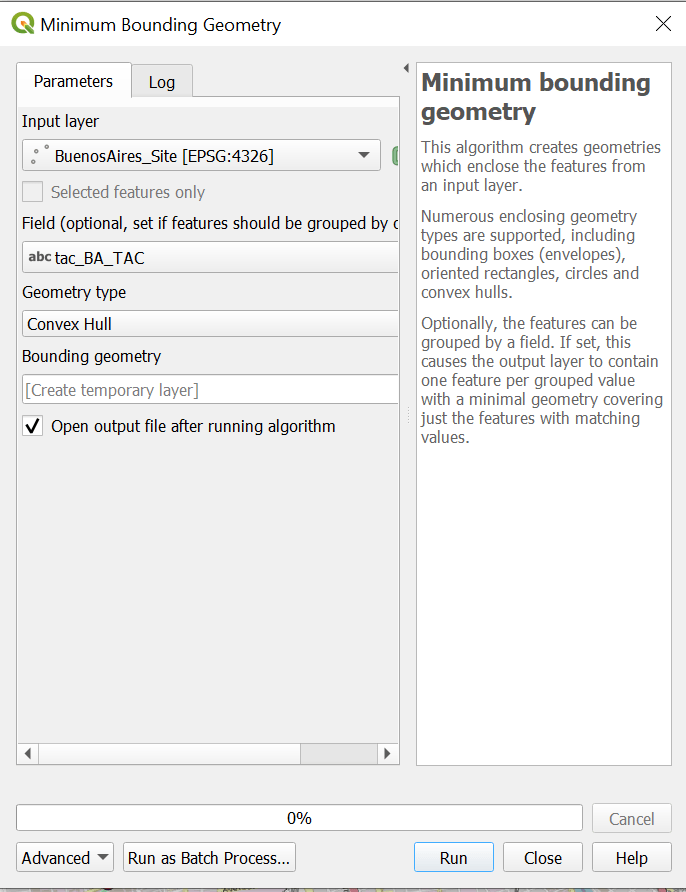
In the input layer I have selected my layer of points, and in the field section I choose the one that carries the TAC value (as is the one that I want to plot). On the Geometry Type there are a couple of options but the one I like the most is Convex Hull (you might want to play around with the different options here).
You can see in the result I get a new layer called Bounding_geometry that has the polygons that contains each TAC. If you right click on this layer you can find the attributes of the two polygons newly created:
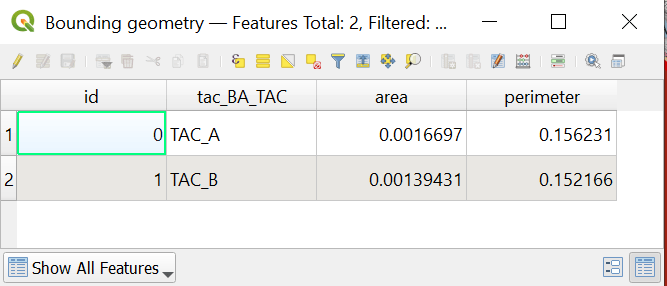
It preserves the BA_TAC column that was used to generate the polygon and it added an area value and a perimeter values as well.
One last thing is that you can add an offset to the polygons as you might saw that it passes through the points. To add an offset you can go to Vector > Geoprocessing Tools > Buffer and you will solve this issue.
Method #2: The second method has mores steps, but the final result is way better than the previous one. Again you first need to go to Processing > Toolbox so the same window appears. But here you will choose “Voronoi Polygons” inside Vector Geometry folder:
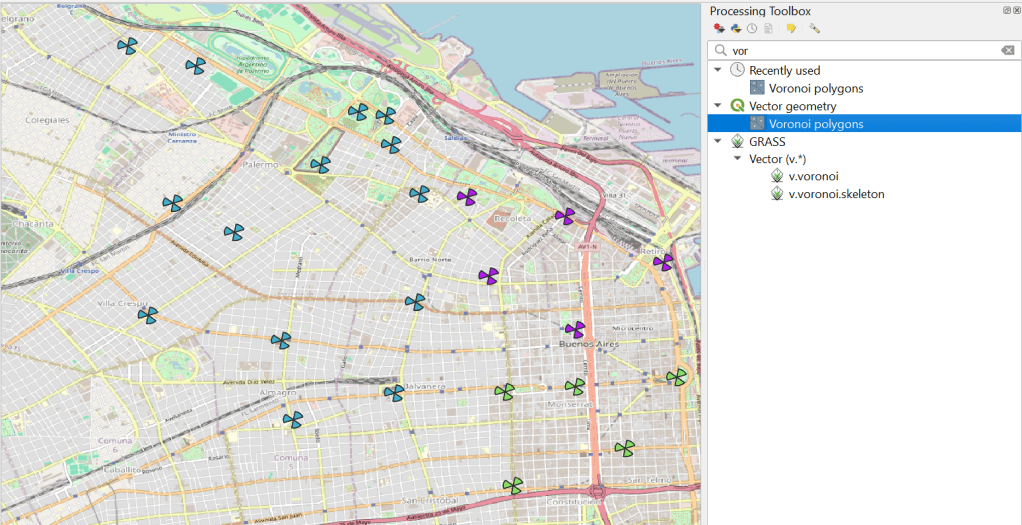
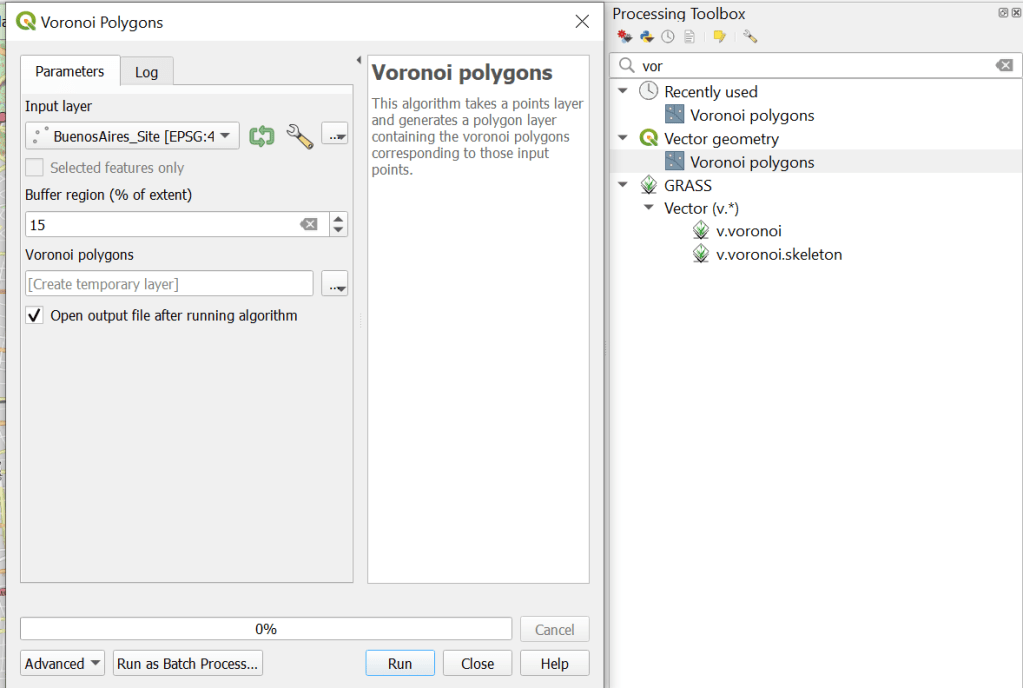
Very important! this tool only works with symbols. If you have pie wedge sectors like in my previous example… it will not work. After you select Voronoi Polygons the pop up window will allow you to select the input layer and a buffer region. Is good to have a buffer region, and you might want to play around with the best value for you. In this case I set it on 15%.
After it runs it will generate a new layer called “Voronoi Polygons”. This layer will have a boundary on each object, but the boundary area will stretch over all the screen. You can also see the effect of the buffer when zooming out:
You might see that this is far from what we need. But stay with me that there is another step. Now in the processing toolbox window we will select another tool called “dissolve” inside Vector Geometry folder.
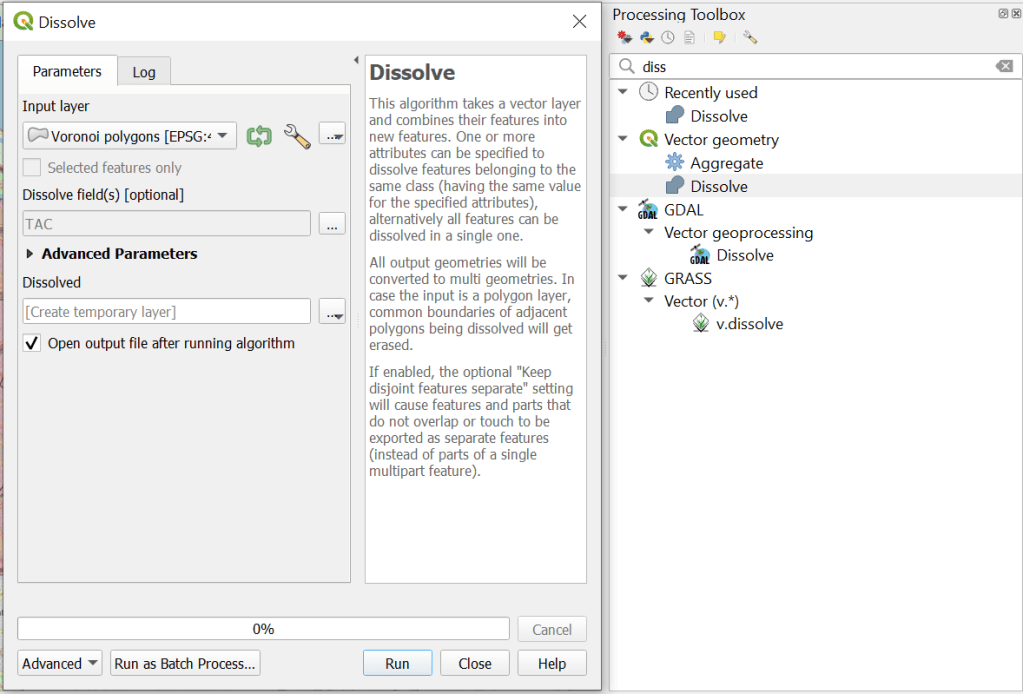
Select the Voronoi Polygons layer recently created and on the dissolve field select the common field you want to use for grouping your points. In my case I have selected TAC. Then hit run:
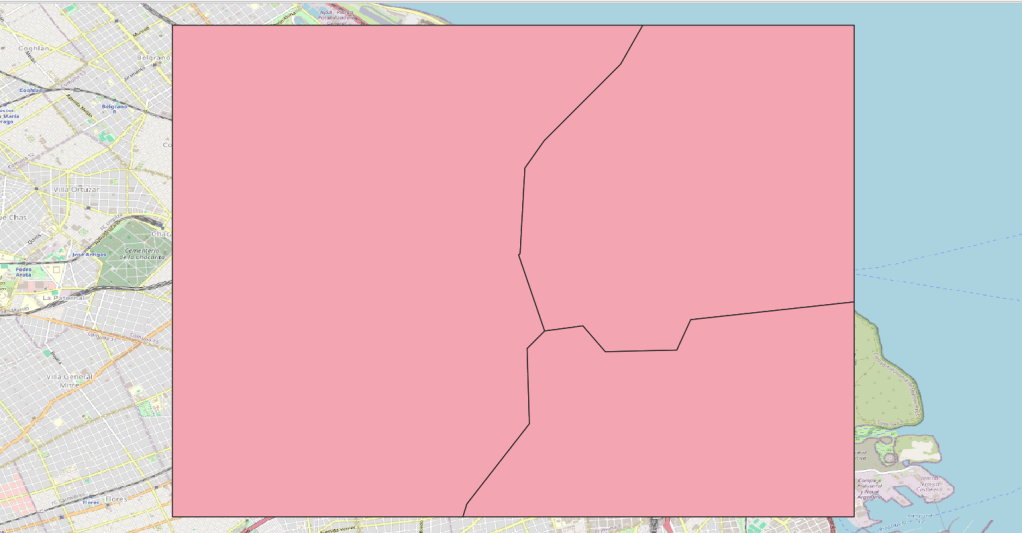
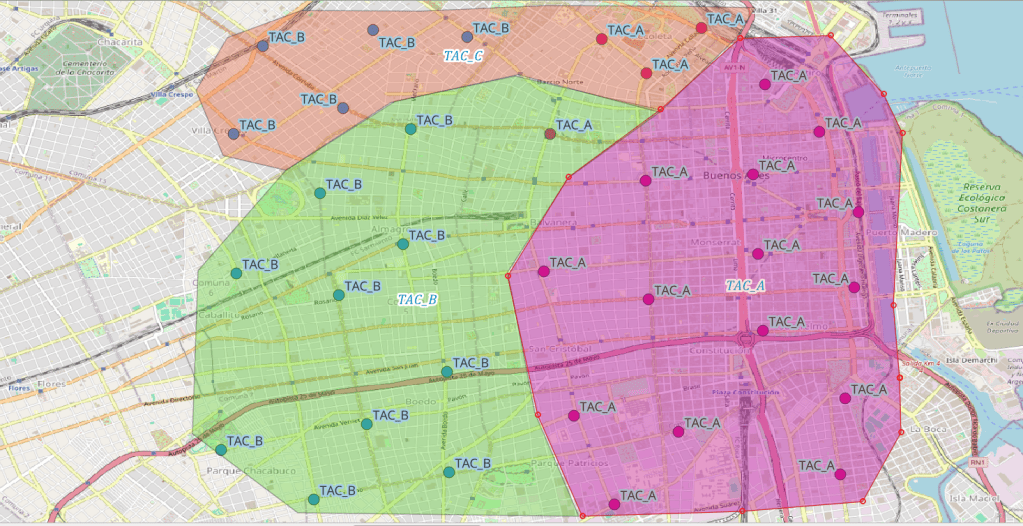
You should end up with something like this. But let create a thematic map to see better the result:
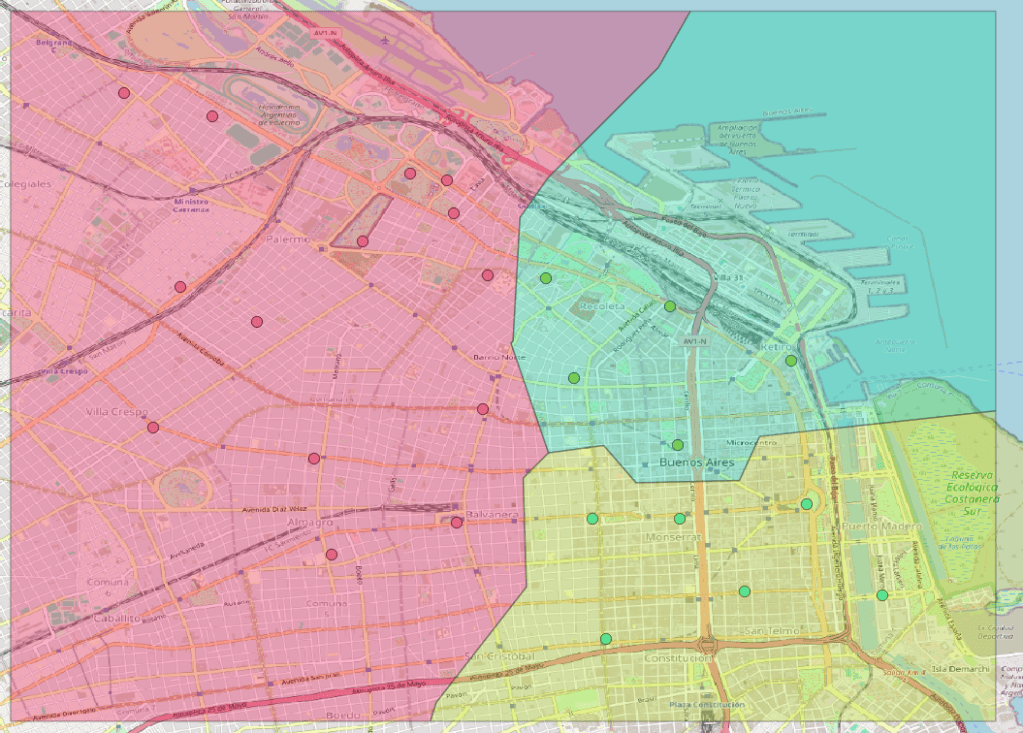
And there you go! a TAC polygon automatically generated by QGis.
Adding an attribute to points based on a polygon
This is the inverse to what I have shown. Imagine you have a point map and a polygon map. Both maps have a common attribute and you want to know if they overlap geographically. In other words you have a polygon of Tracking areas and you map all your sites with a TAC value. The idea here is to identify if there is a site with a TAC that is incorrect. To do this I’ll change a little my map:
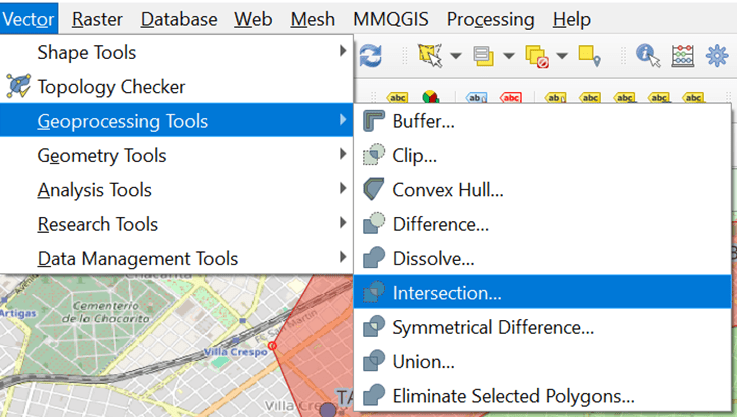
Now I have the two layers: site layer that are points with a TAC value, and a TAC layer that is a polygon with a TAC value as well. So imagine you want to know if there is a site with a different TAC value than the polygon. Here is how to do it: First you select from the top menu Vector > Geoprocessing Tolls > Intersection
The following dialog box will pop out:
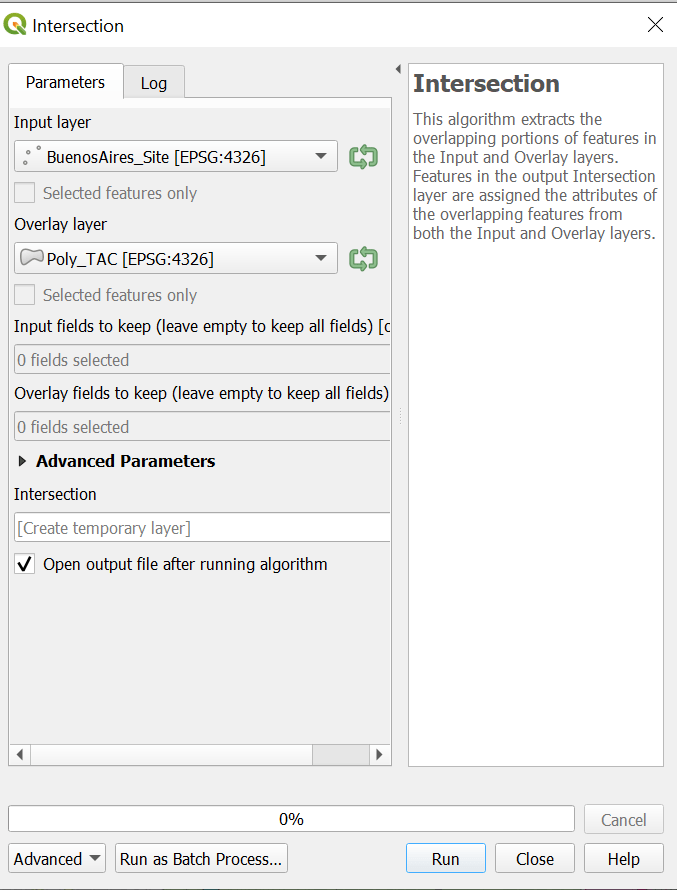
Input layer is the site map (points) and the Overlay Layer is the polygon map. After run it, you will get a new layer called intersection. Lets right click on it and select “Open Attribute Table”

The intersection table we have is the input layer plus the overlay layer together. You can now exported it as csv and in an excel easily spot those sites out of their TAC.
I hope this exercise has helped you in performing these activities in QGIS.
Thanks for reading!
Diego Goncalves Kovadloff
