

There are few things I hate more than doing the same thing over and over again. I manage to automate most of this things, but when it came to reports I got to a dead end… till now. In this post I’ll show you how to create PowerPoint presentations directly from Python and end with the agony of repeating the copy and pasting over and over again. I have structured this post in a particular way: first I’m going to create the slides sharing with you the code and then I’ll go into the methods and details. Lastly I’ll include some cool references in case you need more information. So let’s get started.
Installing Python-pptx
First we need to install the python-pptx package so in the python console or command prompt type the following:
pip install python-pptxAfter installation is complete we are ready to create a PowerPoint document. There are many options to play with the slides type, but I’m going to share two of the ones I used the most. In fact, the second one (a comparison slide) has in it all the details explained so you can apply them for all the other types. Another thing I have to mention is that I preferred python graphs and data frames rather than shapes in Microsoft office. So the picture I’m using I have extracted from a previous analysis in seaborn. In later post I’ll show you how to do exactly that.
Creating a Title / sub-title slide
from pptx import Presentation
# Creating an Presentation object
prs = Presentation()
# Creating slide layout > index selects the type of layout
title_slide_layout = prs.slide_layouts[0]
# Adding a slide
slide = prs.slides.add_slide(title_slide_layout)
# Adding a Title
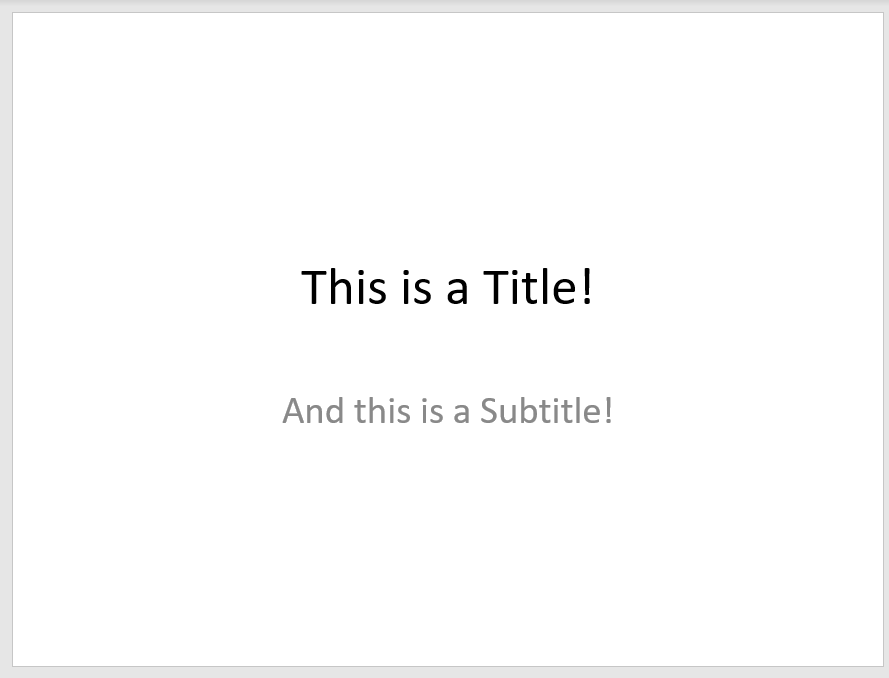
title = slide.shapes.title
title.text = "This is a Title!"
# Adding a Subtitle
subtitle = slide.placeholders[1]
subtitle.text = "And this is a subtitle!"
# Saving the presentation
prs.save('Test1.pptx')
Congratulations! we got the first slide! I want you to notice in the first part of the code this instruction:
title_slide_layout = prs.slide_layouts[0]The index [0] is used to select the type of slide we are using. There are 9 different layouts to select:

One last thing is that when saving your file you can add a path to it. Just remember that the path in python is written as in your web browser, with forward slash (/).
Creating a Comparison slide with an image
In this example I’m going to generate a comparison slide, that has bullets and an image grabbed from my computer. I’ll play around with the bullet levels and fonts so you can have a glimpse of what it can be achieve.
# Import Inches (to place objects and images) and Presentation
from pptx.util import Inches
from pptx import Presentation

# Defining picture path
img_path = 'C:/Users/Your picture path/Picture1.png'

# Creating a Presentation object
prs = Presentation()

# Selecting a comparision slide layout
comparision_slide_layout = prs.slide_layouts[4]

# Inserting a comparision slide
slide = prs.slides.add_slide(comparision_slide_layout)

# Adding a Title to the slide
title = slide.shapes.title
title.text = "Presentation Title - My python pptx"

# Adding a title to container in the left - Placeholders[1]
shapes = slide.shapes
body_shape = shapes.placeholders[1]
tf = body_shape.text_frame
tf.text = 'Use _TextFrame for title'

# Adding text in bullet format to container on the left - Placeholders[2]
body_shape_in = shapes.placeholders[2]
tfi = body_shape_in.text_frame
p = tfi.add_paragraph()
p.text = 'Use _TextFrame.text for first bullet'
p.level = 0

# Adding a second bullet in the same container
p2 = tfi.add_paragraph()
p2.text = 'Use _TextFrame.text for second bullet'

# We can define a specific text format for each bullet
p2.font.bold = True
p2.font.italic = True

# Level indicates the bullet level of the text
p2.level = 0

# We can even add more text in the next bullet level
p3 = tfi.add_paragraph()
p3.text = 'Use _TextFrame.text for second bullet level'
p3.level = 1

# Adding a title to container in the Right - Placeholders[3]
body_shape_otro = shapes.placeholders[3]
tf3 = body_shape_otro.text_frame
tf3.text = 'Use _TextFrame for title 2'

# Finally adding a picture
shapes.placeholders[4].picture = pic
left = Inches(5.1)
top = Inches(2.4)
width = Inches(4.5)
height = Inches(4.3)
pic = shapes.add_picture(img_path, left, top, width, height)

# Saving the presentation
prs.save('C:/Users/Your saving path/test2.pptx')
This example has most of the objects you will find in all layouts. As I mentioned before I preferred seaborn graphs and pandas data frames to insert in power point than creating a table or a graph object. Still if you like them you can create them easily (check the reference section). Another thing to mention is that if you have a certain style defined for your power point presentation (a master slide) Python-pptx inherit all the styles if working directly with it.
Python-pptx and Py-excel allow us to interact with common office tools. This is very useful when the company you work for still uses massively office tools but you have started enjoying python powerful tools. I hope this post help you start automating reports. If you have any doubt, please let me know in the comment section below.
Cheers!
Diego Goncalves Kovadloff
References:
https://python-pptx.readthedocs.io/en/stable/user/quickstart.html
